Body mass index (BMI) uses height and weight to produce a screening number. You can calculate it manually with either the metric or imperial formula below, or use the adult BMI calculator.
Continue reading “Body Mass Index (BMI) formula”BMI chart for men and women (imperial)
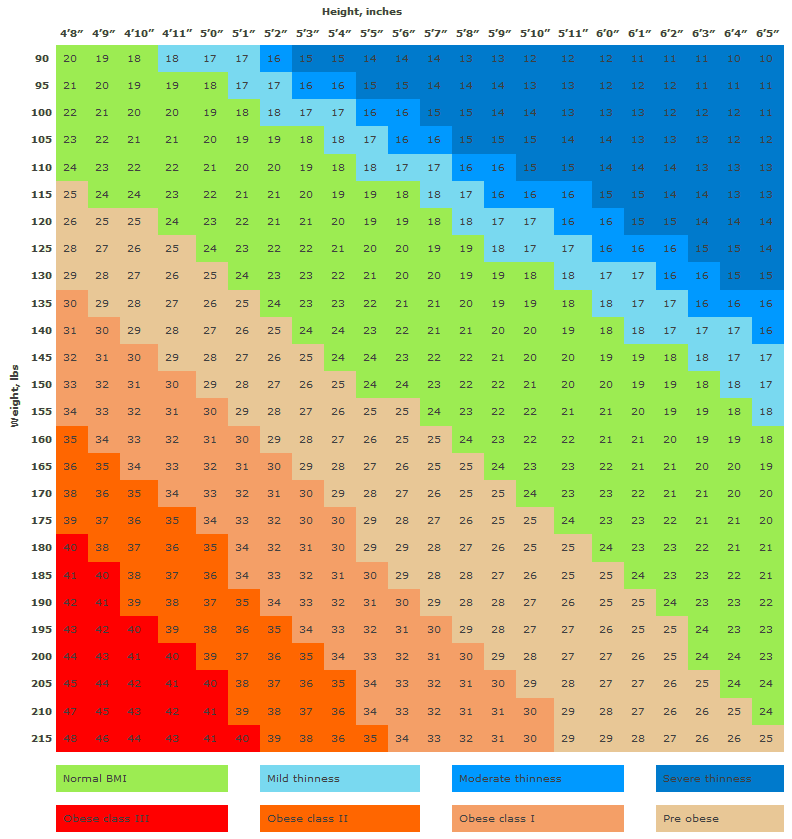
Use this imperial BMI chart to look up an approximate adult BMI from height in feet and inches and weight in pounds. Find your height across the top, your weight down the left, and read the value where the row and column meet.
How to read the imperial BMI chart
- Choose the height column closest to your height in feet and inches.
- Choose the weight row closest to your weight in pounds.
- The intersecting cell shows an approximate BMI rounded to a whole number.
For a result using your exact measurements, use the BMI calculator. To calculate it manually, see the BMI formula.
Adult BMI category table
| BMI | Adult category |
|---|---|
| Below 18.5 | Underweight |
| 18.5 to below 25 | Healthy weight |
| 25 to below 30 | Overweight |
| 30 to below 35 | Obesity, Class 1 |
| 35 to below 40 | Obesity, Class 2 |
| 40 or higher | Obesity, Class 3 |
These categories are for adults aged 20 and older. The formula and category thresholds are the same for adult men and women, although BMI does not account for differences in muscle mass, body composition or fat distribution. See the CDC adult BMI categories.
Need kilograms and centimetres? Use the metric BMI chart. Children and teenagers need age- and sex-specific BMI interpretation.
Reference information reviewed 29 August 2026. BMI is a screening measure, not a diagnosis or a substitute for medical advice.
Related BMI tools
BMI chart for men and women (metric)
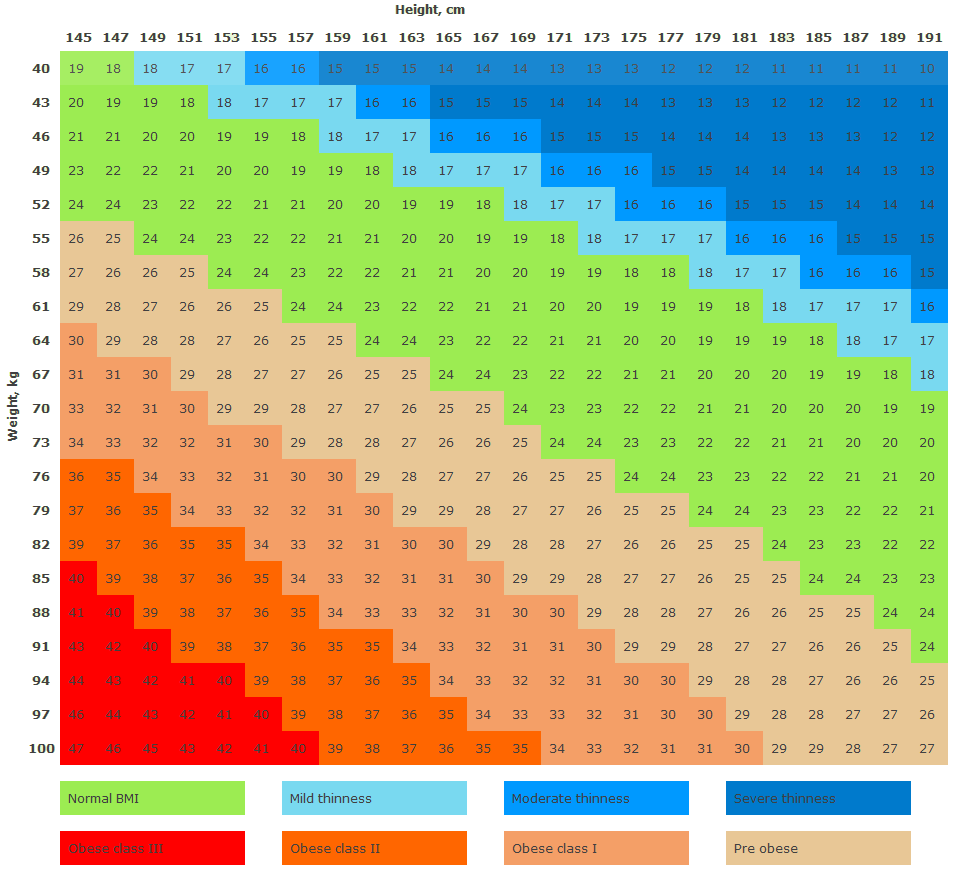
Use this metric BMI chart to look up an approximate adult BMI from height in centimetres and weight in kilograms. Find your height across the top, your weight down the left, and read the value where the row and column meet.
How to read the metric BMI chart
- Choose the height column closest to your height in centimetres.
- Choose the weight row closest to your weight in kilograms.
- The intersecting cell shows an approximate BMI rounded to a whole number.
For a result using your exact measurements, use the BMI calculator. To calculate it manually, see the BMI formula.
Adult BMI category table
| BMI | Adult category |
|---|---|
| Below 18.5 | Underweight |
| 18.5 to below 25 | Healthy weight |
| 25 to below 30 | Overweight |
| 30 to below 35 | Obesity, Class 1 |
| 35 to below 40 | Obesity, Class 2 |
| 40 or higher | Obesity, Class 3 |
These categories are for adults aged 20 and older. The formula and category thresholds are the same for adult men and women, although BMI does not account for differences in muscle mass, body composition or fat distribution. See the CDC adult BMI categories.
Need pounds, feet and inches? Use the imperial BMI chart. Children and teenagers need age- and sex-specific BMI interpretation.
Reference information reviewed 29 August 2026. BMI is a screening measure, not a diagnosis or a substitute for medical advice.